January results surprise to the upside, as Sydney and Melbourne growth rates stabilise - CoreLogic
Contact
January results surprise to the upside, as Sydney and Melbourne growth rates stabilise - CoreLogic
CoreLogic’s national measure of housing values rose by 1.1% in January, up 10 basis points from the December result, when the national index was up 1.0%.
CoreLogic’s national measure of housing values rose by 1.1% in January, up 10 basis points from the December result, when the national index was up 1.0%. Five of the eight capital cities recorded a modest uptick in the monthly rate of growth, including Melbourne, which had posted a slight decline in values in the previous month. However, the quarterly change continued to soften, reflecting the longer-term trend of slowing growth across most regions of Australia.
CoreLogic’s Research Director, Tim Lawless, notes housing stock is thinly traded during January and it will be important to monitor the trend as transactional activity picks up.
“As the volume of home sales moves out of seasonal lows, we should get a firmer reading on how 2022 is shaping up,” he said.
“The early indication is that housing markets are starting 2022 with a similar trend to what we saw through late last year. Values are still broadly rising, but nowhere near as fast as they were in early 2021.”
“A softening in growth conditions has been influenced by less government stimulus, worsening affordability, rising fixed term mortgage rates and, more recently, a slight tightening in credit conditions, and a surge in new listings through the final quarter of last year.”
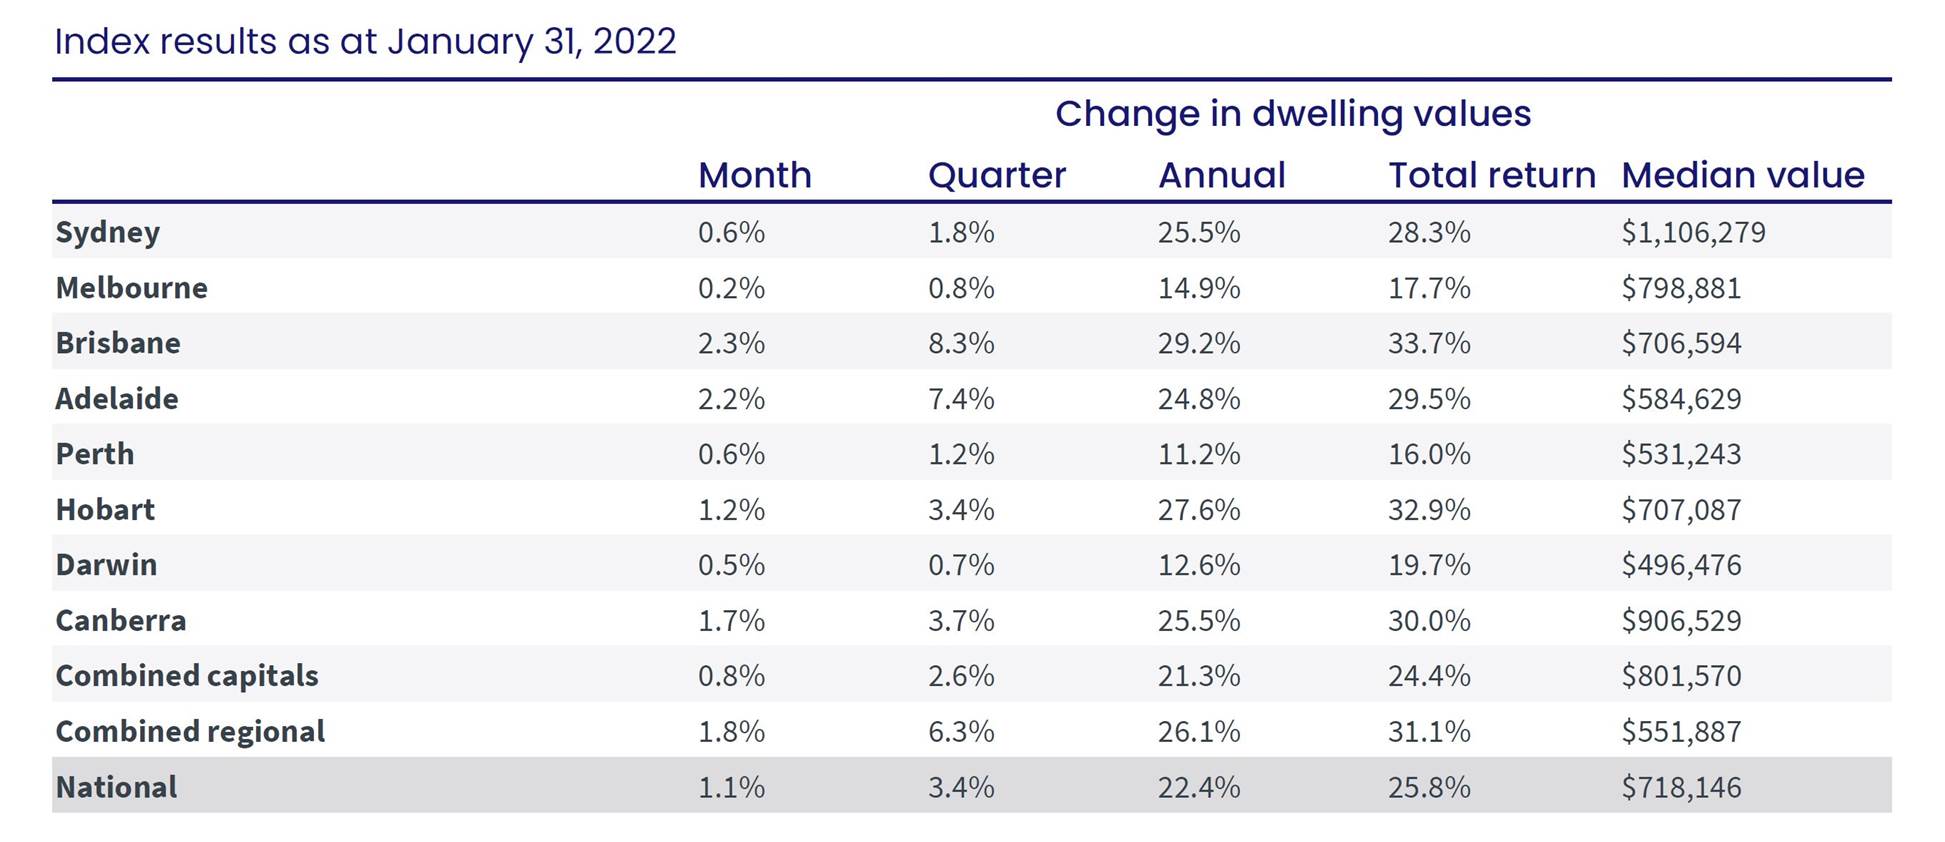
The annual change in national housing values reached a new cyclical high in January, with Australian dwellings up 22.4% over the year; the highest annual rate of growth since June 1989. In approximate dollar value terms, the typical Australian home is now worth $131,236 more than it was a year ago. Brisbane has recorded the highest annual growth rate across the capital cities, with housing values up 29.2% (approx. $159,763).
Continuing a pattern seen over recent months, the January results showed greater diversity, with Brisbane (2.3%) and Adelaide (2.2%) leading the pace of gains ahead of Hobart (1.2%) while growth in Melbourne (0.2%), Darwin (0.5%), Sydney and Perth (both 0.6%) recorded substantially softer outcomes.
Regional markets have again shown a substantially stronger result for housing values, with the combined regionals index up 1.8% over the month and 6.3% over the rolling quarter. This compares with a 0.8% and 2.6% rise respectively across the combined capital cities over the same periods.
Similar to the capital cities, it was regional Queensland (2.0%) and regional South Australia (2.1%) that led the pace of growth over the month, however every broad ‘rest of state’ region recorded at least a 1.2% gain, demonstrating a depth of demand for regional housing.
Regional Australia’s outperformance relative to the capitals has been a feature through most of this cycle to date, driven by a combination of higher demand and low levels of advertised supply.
Houses are still recording a higher rate of growth than units. Nationally house values were up 1.3% in January compared with a 0.3% rise in unit values; a trend that has been apparent throughout the pandemic.
Three of the eight capital cities are now recording a median house value over the $1 million dollar mark. Melbourne’s median house value surpassed $1 million for the first time in January, while it was the second month in a row Canberra’s median house value passed $1million. In Sydney, the median house value climbed to just under $1.39 million. The difference between the national median house and unit value reached a new record high of 28.3% in January. This may see demand gradually deflect towards the more affordable medium-to-high density sector of the market.
A multi-speed dynamic has emerged across the capital cities. After capital city housing values moved through a synchronised and broad-based upswing through most of the current growth phase, a new trend of diversity is emerging as the cycle matures.
Brisbane and Adelaide stand out amongst the capital cities, with housing values continuing to rise at more than 2% month-on-month while growth conditions across the remaining capital cities has slowed.
The slowing trend in Sydney and Melbourne can at least partially be explained by a larger deposit hurdle caused by higher housing prices alongside low income growth, along with higher advertised inventory levels and weaker demographic trends.
Slower conditions across Perth’s housing market may be more attributable to the disruption to interstate migration caused by the extended closure of state borders, which has had a negative impact on housing demand. In Brisbane and Adelaide, housing affordability is less challenging, advertised stock levels remain remarkably low and demographic trends continue to support housing demand, especially across South East Queensland.
The performance gap between regional Australia and the capitals widened in January. Over the past three months, the combined regionals index has recorded growth of 6.3% compared with a 2.6% rise in the combined capital city index. The differential of 3.7 percentage points is now at a cyclical high as growth across Australia’s regional markets remains high while the capital city trend slows.
Over the past 12 months, the strongest regional markets have been areas generally popular as commutable markets with lifestyle characteristics such as the Southern Highlands and Shoalhaven (+37.6%), Sunshine Coast (+34.4%) and the Hunter Valley (excluding Newcastle) (34.0%). However, over the most recent three months, more rural regional markets such as the Central West and Capital Region of NSW have climbed the ranks.
Continued in the attached media release including graphs, charts and additional commentary and data on:
- Listings
- Sales volumes
- Rents
- Rental yields
For more information, visit www.corelogic.com.au.
Similar to this:
Second busiest week for auctions across the combined capital cities so far this year - CoreLogic
Australian housing market surpasses $9 trillion valuation - CoreLogic


