New listings continue to fall down 42% nationally as cost of borrowing hurts the demand to buy - Ray White Research
Contact
Feb 6, 2023
New listings continue to fall down 42% nationally as cost of borrowing hurts the demand to buy - Ray White Research
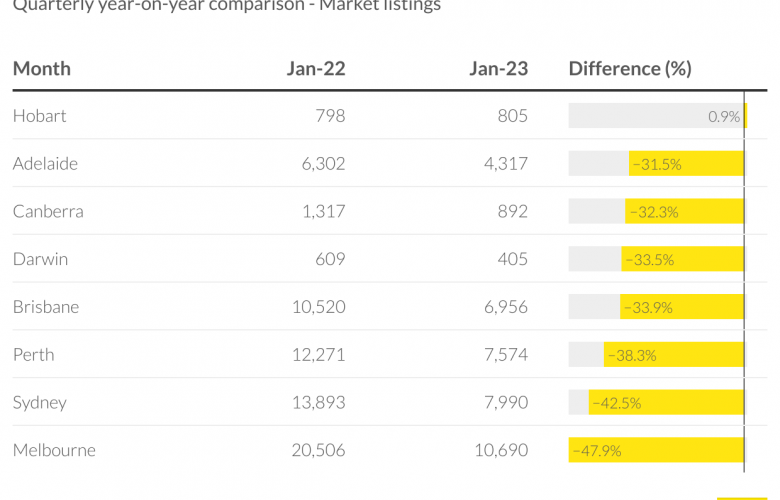
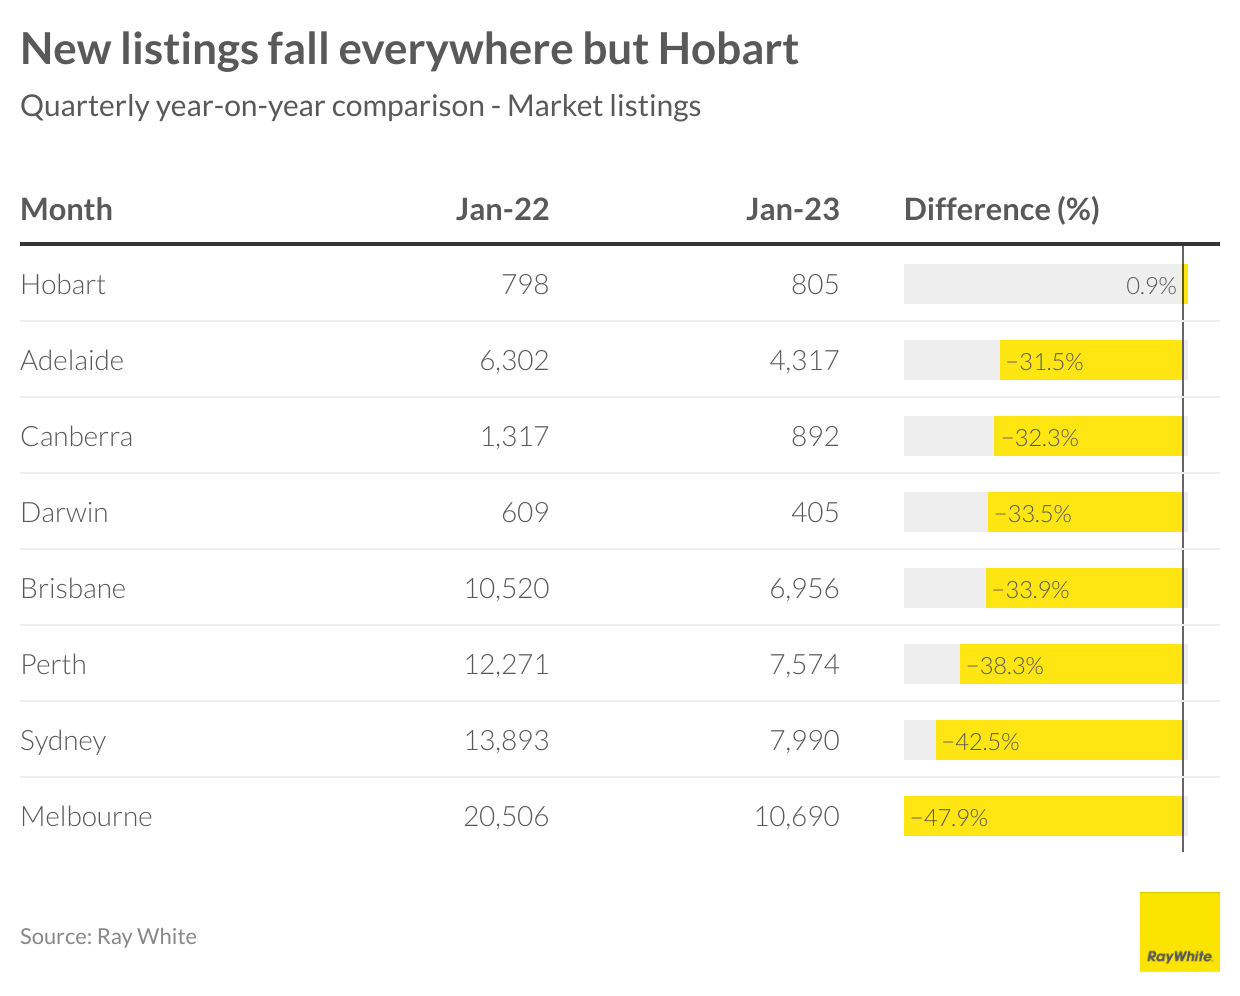
New listing rates in Melbourne (- 47.9%) and Sydney (-42.5%) are both down, with such heavy losses mostly being responsible for the 42 per cent decline for Australia. Every major city has had new listings decline except Hobart.
-
 William Clark Ray White Data Analyst
 -
 Ray White Listing data
 -
 Ray White Reasearch demand for property
New listings continued their run of diminished activity in the three months to January , with year-on-year new listings down 42 per cent compared to the three months to January 2022. It has provoked some discussion of where the normal trend for market listings lies, as dwelling prices correct, interest rates rise, and inflation stubbornly remains in a less-than-acceptable range.
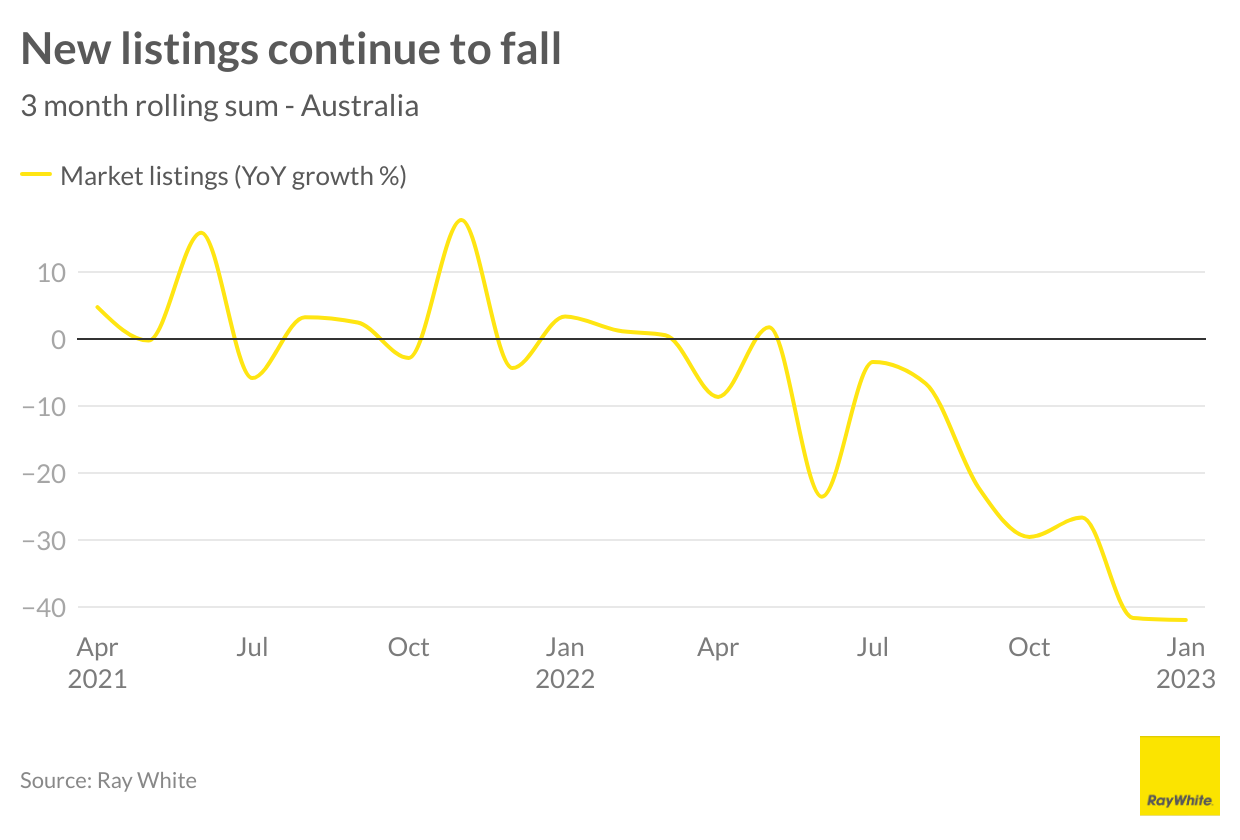 While new listings continue to drop, they have only do so in a steady fashion, when compared to the rapid gains during the pandemic. New listing drops are also in step with other indicators of anaemic in the housing market, with median days on market and vendor discounting at a high since the start of the pandemic.
New listing rates in Melbourne and Sydney are both down, with such heavy losses mostly being responsible for the 42 per cent decline for Australia. Every major city has had new listings decline except Hobart, which barely netted positive growth over the last period.
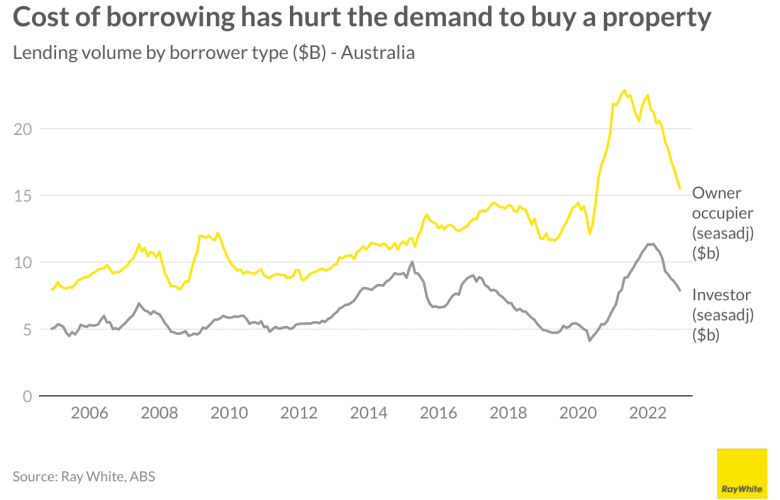
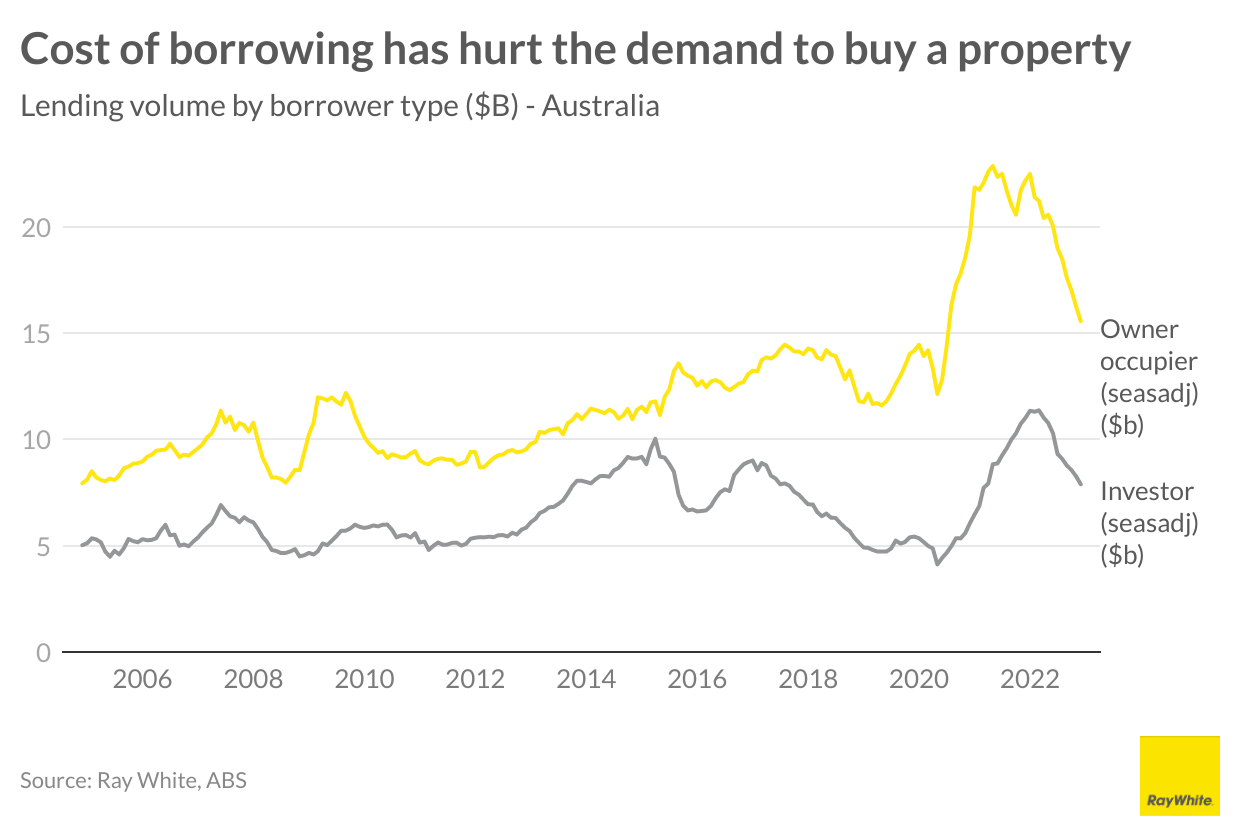
 So what is behind the continued downward trend? Typically, with drops in property values there is an incentive for prospective vendors to try and wait out the lull in prices, though we have seen with sales dropping faster than new listings it is buyers too who are changing their behaviour from last year, despite the lower prices making housing more affordable. Prospective buyers are unlikely to be satisfied with a diminished supply of new stock, and scarcity seems to be doing little to elevate prices at this stage.
Sign up here to receive our newsletters and breaking news sent straight to your inbox.
Contact Details:


