Annual appreciation in national house and unit values fall 10 basis points for the first time since July 2021
Contact
Annual appreciation in national house and unit values fall 10 basis points for the first time since July 2021
Corelogic's Kaitlyn Ezzy talks about the Australian Unit Market.
At the national level, value appreciation slowed by 10 basis points in April across both houses (0.7%) and units (0.2%). This slowing in the monthly growth rate has seen the annual appreciation in national unit values fall to 10.4%, while the annual growth in national house values fell below 20% for the first time since July 2021 (18.4%) to 18.6%, resulting in an annual performance gap of 8.2%.
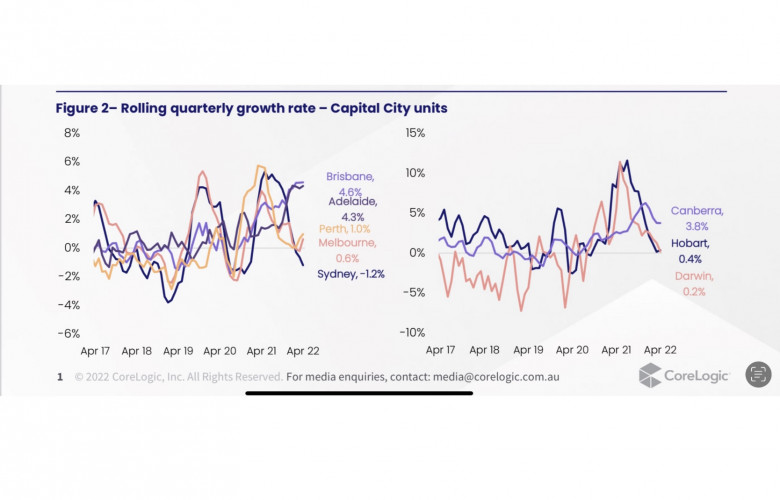
Over the three months to April, unit values across the combined capitals rose 0.2%, compared to the 1.3% rise recorded for houses. Making up 38.6% of the capital city unit market, the -1.2% decrease in Sydney’s unit values weighed heavily on the combined capitals growth metric, with all other capitals reporting quarterly growth above or in line with the combined capitals.
Brisbane (4.6%) led the pace of quarterly growth, recording its highest quarterly growth rate since January 2008 (4.9%), followed by Adelaide (4.3%) and Canberra (3.8%). Across Perth and Melbourne, unit appreciation appears to be regaining some steam with Melbourne units recording a 0.4% increase in values over April, resulting in Melbourne’s first positive quarterly growth rate since January, while Perth’s quarterly growth rate has recovered from 0.0% over the three months to January to 1.0% over the three months to April. Hobart’s unit values rose 0.6% over the month of April, while Darwin’s values rose 0.2% over the same period.
Regional units
Regional houses (1.4%) continued to outperform regional units (1.0%) in April, with the pace of growth easing across both segments from the 1.7% rise seen in March. Following a similar trend to the capital, Regional QLD led the pace of quarterly growth, recording a new cyclical high of 6.3%, followed by regional WA (3.6%), regional Tasmania (2.8%) and regional NSW (2.7%). While value growth across most unit and house markets is now losing momentum, Brisbane and Regional QLD units are yet to show signs of a slowdown in growth.
Unit listings
Listings continue to help explain some of the divergence amongst the capitals. Total unit listings levels in Brisbane and Adelaide remain approximately 40% below the previous five-year average despite the newly advertised unit listings having somewhat normalised over recent months. At the other end of the spectrum, Sydney and Melbourne’s total advertised unit supply is now between 8% and 17% above the average, suggesting that more units are being added to market than are being sold. Total listings levels in the combined regional unit market also remain low, helping bolster the strong growth seen across regional Australia.


