Decline in housing values for second straight month
Contact
Decline in housing values for second straight month
As real estate turnover starts to recover from the April low, CoreLogic show that house prices continue to head south.
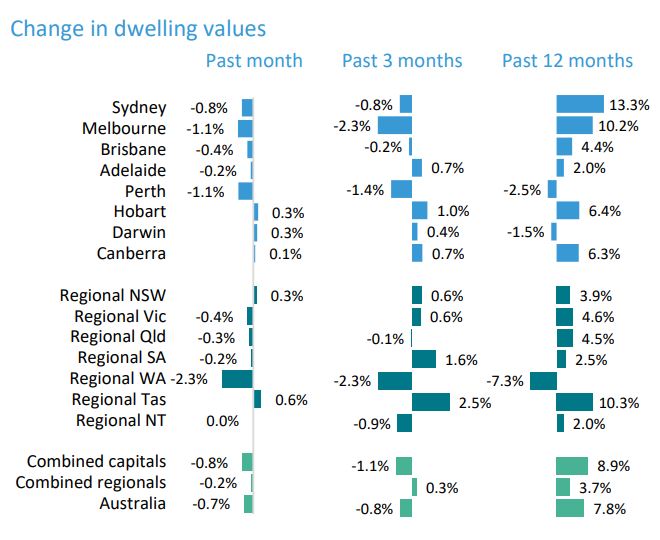
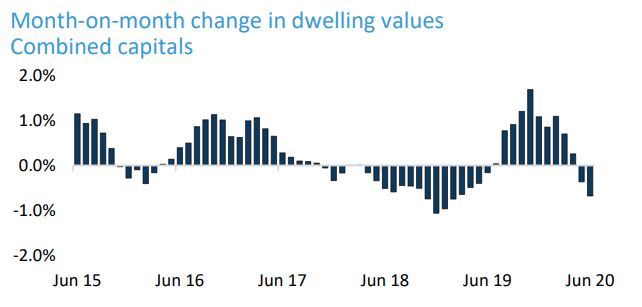
It is not good news for home owners as the new financial year begins with the CoreLogic Home Value Index recording a second consecutive month of falls, following a 0.4 per cent decline in May, with the national index down by 0.7 per cent in June.
Each of the five largest capital cities recorded a decline in home values over the month, ranging from a drop of 1.1 per cent in Melbourne and Perth to 0.2 per cent in Adelaide.
The indices for Hobart, Canberra and Darwin each recorded a subtle rise in values over the month.
At a Glance:
- Each of the five largest capital cities recorded a decline in home values over the month
- Despite values being down in June, estimates of market activity showed a further improvement
- CoreLogic’s estimate of home sales in June was up a further 29.5 per cent
Despite values being down in June, estimates of market activity showed a further improvement from the April low.
After a (revised) 21.5 per cent surge in sales activity through May, CoreLogic’s estimate of home sales in June was up a further 29.5 per cent.
“The downwards pressure on home values has remained mild to-date, with capital city dwelling values falling a cumulative 1.3 per cent over the past two months," Said CoreLogic head of research, Tim Lawless.
"A variety of factors have helped to protect home values from more significant declines, including persistently low advertised stock levels and significant government stimulus.
"Additionally, low interest rates and forbearance policies from lenders have helped to keep urgent sales off the market, providing further insulation to housing values.
"Recent value falls represent an interrupted upswing across most regions, reflected in high annual growth rates.
“The twelve month change in home values remains in positive double digit territory across Sydney (13.3 per cent) and Melbourne (10.2 per cent).
Source: CoreLogic
Mr Lawless said the only capitals where values show declines on an annual basis are Perth and Darwin, but even across these cities, home values were early into a recovery phase pre-COVID.
Nick Lennan of McGrath Coogee told WILLIAMS MEDIA he's noticed the 'cookie cutter' older style properties seem more affected by price than many of the properties in his patch.
"What I've noticed is in the Eastern Suburbs, prices are very resilient as certain properties don't get affected by market fluctuations," said Mr Lennan.
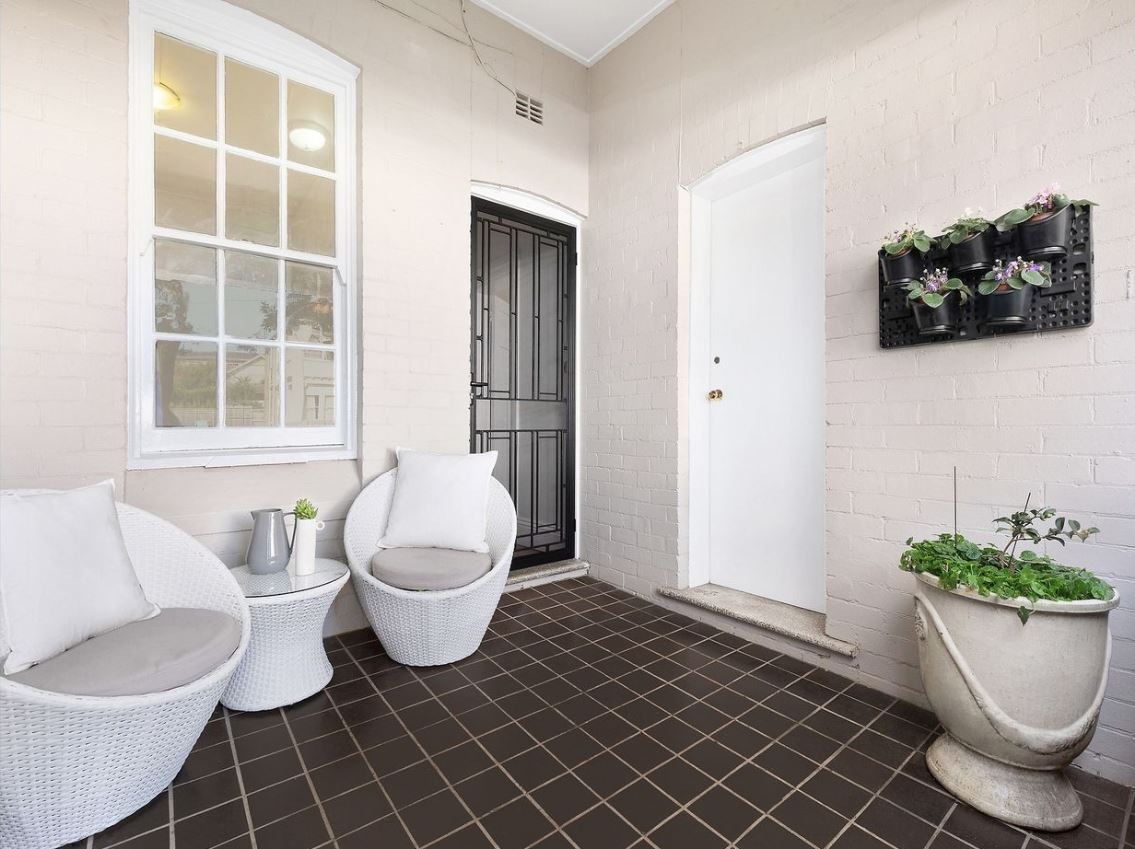
"A semi-detached, art deco style property, with no parking, will be very tightly held.
"I recently sold 5/23 Dudley Street in Coogee that the vendor had bought in 2017, the only renovations they had done I believe was to update the bathroom and it has just sold for $1.15m."
5/23 Dudley Street, Coogee recently sold through agent Nick Lennan of McGrath Coogee has held its value. Photo: McGrath
In Brisbane, Hamish Bowman of Ray White New Farm told WILLIAMS MEDIA it wasn't so much pricing that was changing but the negotiation process.
"Our area is all Brisbane's attraction suburbs and while prices haven't been affected, I've noticed the negotiation process is taking longer," said Mr Bowman.
"Banks and solicitors are advising their clients to wait up to 30 days, rather than the 7 or 14 days."
Although the decline in home values has been fairly mild since April, the longer term outlook remains highly uncertain.
“While it is encouraging to see lenders have recently hinted at an extension in their repayment leniency policies, the government stimulus will eventually taper and banks will require borrowers to repay their loans," said Mr Lawless.
"The longer term outlook for the housing market is largely dependent on how well the economy is tracking when these support measures are removed."
Source: CoreLogic
Hedonic Home Value Index
A variety of peripheral housing market indicators have started to look more positive through June.
Real estate agent activity is now tracking higher than the same time last year.
The number of comparative market analysis (CMA) reports was tracking 6 per cent higher than this time last year.
CMA activity is highly correlated with new listings activity, with a two week lead.
Source: CoreLogic
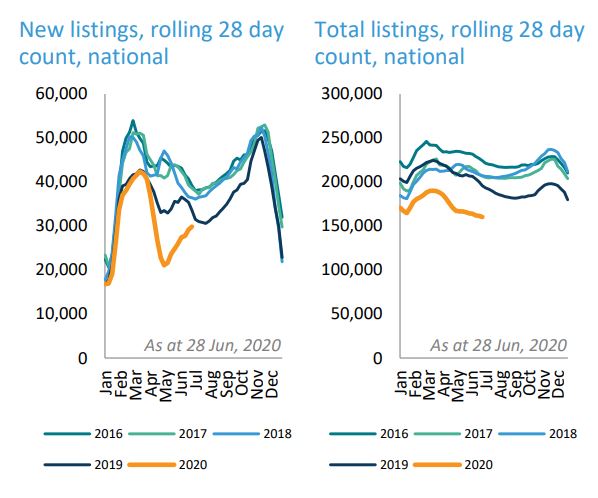
With real estate agent activity bouncing back, the number of fresh real estate listings has been ramping up since early May.
The rolling 28 day count of new listings remained lower than a year ago, but was 42 per cent higher relative to the recent low in early May.
While new listings are ramping up, the total listing count has continued to trend lower, indicating a strong rate of absorption.
Auction markets have shown a partial recovery, with the combined capital city clearance rate averaging 59.9 per cent since mid-May.
Clearance rates reached a record low of 30.2 per cent through April as a result of the temporary ban of on-site auctions.
This saw withdrawal rates peak at 56 per cent and more than 80 per cent of successful auction sales were negotiated prior to the auction rather than under the hammer.
Since late May, as the ban on auctions has lifted, withdrawal rates have tracked around the 10 per cent with the large majority of auctions selling under the hammer rather than before or after the event.
Consumer sentiment readings provide a further signpost for improving housing market activity.
After plunging in April, the monthly Westpac/MI consumer sentiment reading improved by 16.5 per cent in May followed by a further 6.4 per cent rise through June.
Similarly, as of the 28th of June, the weekly ANZ/Roy Morgan consumer confidence series has recorded a 42 per cent lift since the end of March.
Consumer sentiment readings show a high correlation with housing market activity.
Although these readings remain well below the long run average, improved consumer sentiment helps to explain the rise in listing numbers, and a strong rate of absorption via a higher rate of turnover.
The most expensive quartile of housing is continuing to lead the downturn.
“Higher value markets tend to be more reactive to changes in the environment, having led both the upswing and the downturn over previous cycles," said Mr Lawless.
"The past three months has seen this trend playing out, with upper quartile values down 1.7 per cent across the combined capital city index over the past three months, while lower quartile values have fallen by only 0.3 per cent.”
This capital city trend is driven mostly by Sydney and Melbourne, while the smaller cities have shown a mixed result across the valuation cohorts.
In Sydney the upper quartile is down 1.3 per cent over the past three months, while lower quartile values are up 0.2 per cent.
Similarly, over the same period in Melbourne, upper quartile values are down 3.7 per cent while lower quartile values have declined a more modest 0.5 per cent.
Importantly, the upper quartile also recorded the most significant run-up in values throughout the second half of last year.
Similar to this:
Fifth monthly increase in Home Value Index: CoreLogic
Housing downturn loses some steam with CoreLogic House Value Index down 0.6% in March


