Real dwelling values continue their falls over the June 2019 quarter
Contact
Aug 6, 2019
Real dwelling values continue their falls over the June 2019 quarter

With the recent release of the quarterly consumer price index (CPI) data for June 2019, we’ve updated our analysis of real (inflation-adjusted) changes in dwelling values.
Although CPI growth was surprisingly strong over the quarter, coming in at 0.6%, annual inflation at 1.6% remains well below the Reserve Bank’s (RBA) target range of 2% to 3%. June was also the first time in a number of years there was a change to official interest rates, with the RBA reducing the cash rate by 25 basis points with another 25 basis points cut in July.
The RBA Governor recently highlighted in a speech that the expectation is rates will remain lower for longer.
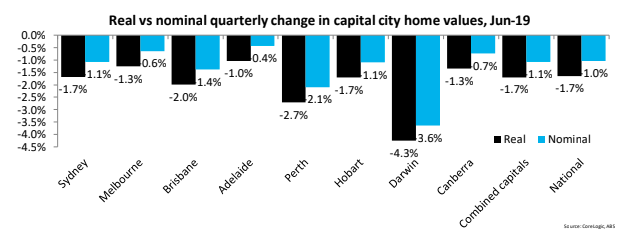
Despite some subtle increases in Sydney and Melbourne nominal dwelling values in June 2019, over the second quarter of the year, nominal dwelling values were lower across all capital cities. The stronger inflation figures have led to larger real dwelling value falls over the quarter. Over recent quarters it has been Sydney and Melbourne than have been recording the largest quarterly falls, however, over the past three months, it has been the persistently weak markets of Perth and Darwin that have recorded the greatest value declines.
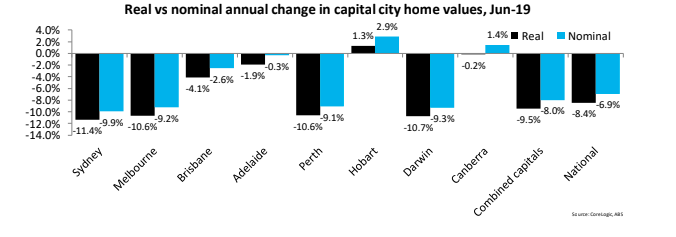
Over the 12 months to June 2019, Hobart and Canberra were the only capital cities that recorded nominal value increases. When those figures were adjusted for inflation it ended up that only Hobart recorded a real increase in values. National dwelling values were -8.4% lower in real terms over the 2018-19 financial year with each of Sydney, Melbourne, Perth and Darwin recording falls in excess of 10%.
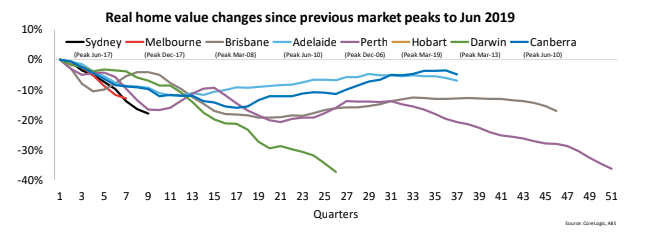
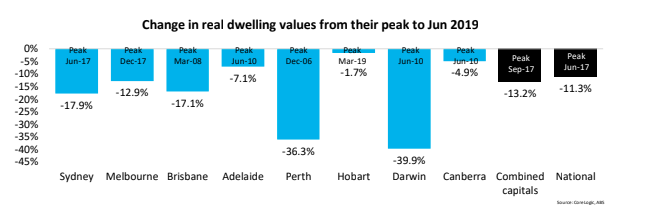
The two charts above track how far away from their peak real dwelling values are across all capital cities, the combined capital cities and nationally. Across all regions, values sit below their peak with the magnitude of declines ranging from slight, such as those in Hobart (-1.7%), moderate, such as those in a city like Melbourne (-12.9%) to substantial, such as those in Perth (-36.3%) and Darwin (-39.9%).
What is also striking is for how long real dwelling values have been below their peak in certain cities. Both Brisbane and Perth have seen values below their peak for more than 11 years while in Adelaide, Darwin and Canberra real values have been below their previous peak for nine years. While the falls are recent in Sydney and Melbourne, the depth of these declines over a short period is significant with the first chart showing the dive in values has been much more rapid than in any of the other capital cities.
Nominal dwelling values have now increased in June and July in Sydney and Melbourne, in Brisbane and Darwin values rose in July and in Hobart they rose in each of the three months to July. It is still very early days but it does appear that the worst of the declines (at least in nominal terms) are now behind.
The expectation is that the recovery will be a slow one and for that reason, real dwelling values may continue to fall. Furthermore, values in markets like Sydney, Melbourne, Perth and Darwin, are expected to take many years to eclipse their previous ‘real’ peaks.
Similar to this:
What APRA (potentially) giveth does comprehensive credit reporting take-away?
The rate of value decline across the most expensive properties is starting to slow
Will the Government’s First Home Loan Deposit Scheme really help first time buyers?


