Riskier lending remains low, according to APRA data
Contact
Riskier lending remains low, according to APRA data
New data from the Australian Prudential Regulation Authority suggests the flow of housing credit may have reached a turning point.
APRA’s property exposures data is published each quarter and provides a summary of lending by ADIs over the quarter. The data is valuable because it gives much more insight into new lending than what is available from the monthly housing finance data, which is published by the Australian Bureau of Statistics (ABS).
Source: CoreLogic
The latest data showed that the value of lending to owner-occupiers was 9.3% higher in the June 2019 quarter than the March 2019 quarter and for investors it was 13.8% higher. Despite the quarterly increase, the value of lending to owner-occupiers was -14.4% lower year-on-year and for investors it was -17.5% lower. As the first chart highlights there has been a steady decline in housing lending demand over recent years however, the latest quarter suggests the flow of housing credit may have reached a turning point.
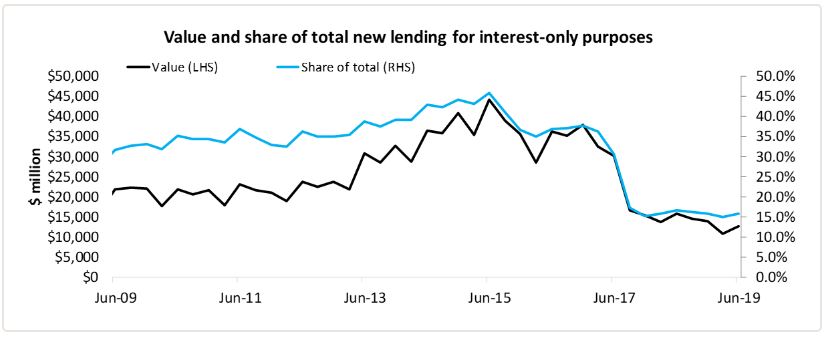
One of the features of the market over recent years has been the reduction in new lending on interest-only terms. Like overall lending, interest-only lending was actually 17.0% higher over the June quarter however, it was -19.6% lower year-on-year. Interest-only mortgages made-up just 15.8% of new mortgages over the quarter, which was slightly higher than the recent low of 14.9%, but much lower than the decade average of 32.5%. The reduction in interest-only lending has been driven by much higher mortgage rates for this product. In fact, if you look at the total outstanding portfolio of interest-only mortgages it has fallen to $359.0 billion, which is its lowest value since September 2012 and its lowest overall share of outstanding mortgages, at 21.6%, any time since March 2008.
Source: CoreLogic
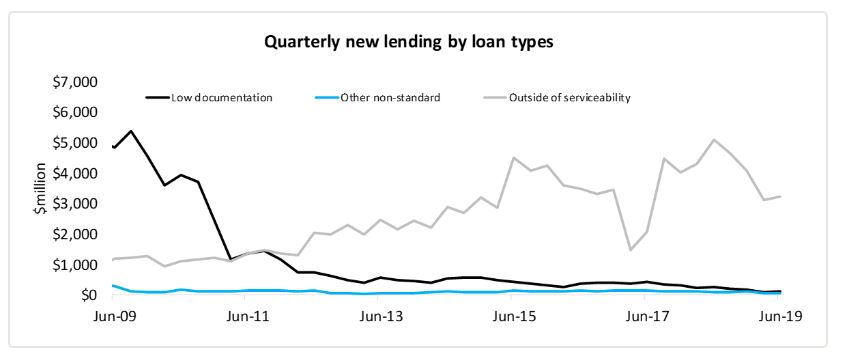
Looking at other types of non-standard lending, over the quarter low-documentation loan approvals increased 33.6%, loans approved outside serviceability increased 4.1% and other non-standard loan approvals fell -21.7%. Year-on-year, the changes were recorded at -52.8% for low-documentation loan approvals, -36.6% for loans approved outside of serviceability and -42.2% for other non-standard loans. Low documentation loans were just 0.1% of the value of loans approved over the quarter while loans approved outside of serviceability were 4.0% (their lowest share since December 2017) while other non-standard loans were also just 0.1%.
Source: CoreLogic
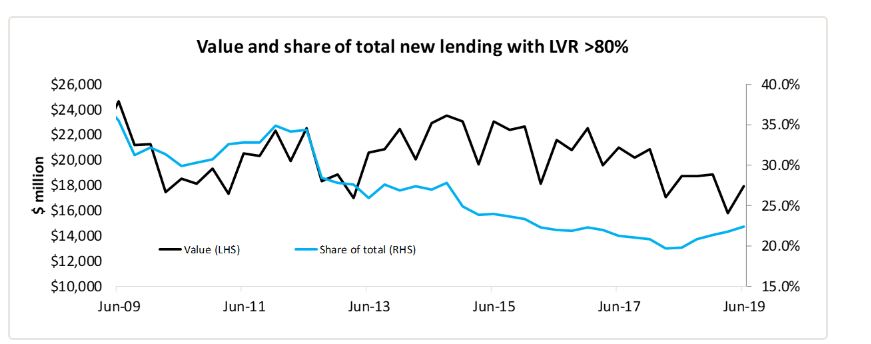
The latest data shows an uptick in high loan to valuation ratio (LVR) lending however, it remains well below historic levels. Lending with an LVR greater than 80% means that the borrowers will typically have to take out lender’s mortgage insurance (LMI). Over the quarter, there was $17.9 billion worth of mortgages written with an LVR greater than 80%, which was 22.4% of all commitments over the quarter. The 22.4% share was the highest since December 2015 but remains well below its peak of 37.6% in March 2009.
Source: CoreLogic
Overall, the data from APRA shows that riskier lending; those loans with a high LVR, interest-only or non-standard mortgages remain a low proportion of new mortgages that are being written. In saying that, there seems to have been a slight increase in the risk appetite over recent quarters and with macroprudential policies eased further during recent months, it wouldn’t be a surprise to see a further moderate increase in demand for non-standard and higher LVR mortgages over the coming quarters.
More from this contributor:
Real dwelling values continue their falls over the June 2019 quarter
What APRA (potentially) giveth does comprehensive credit reporting take-away?


