Sellers respond to rising market with property listings increase
Contact
Dec 4, 2019
Sellers respond to rising market with property listings increase
Property sale listings across Australia have increased for November despite year on year listings declining, according to SQM research.

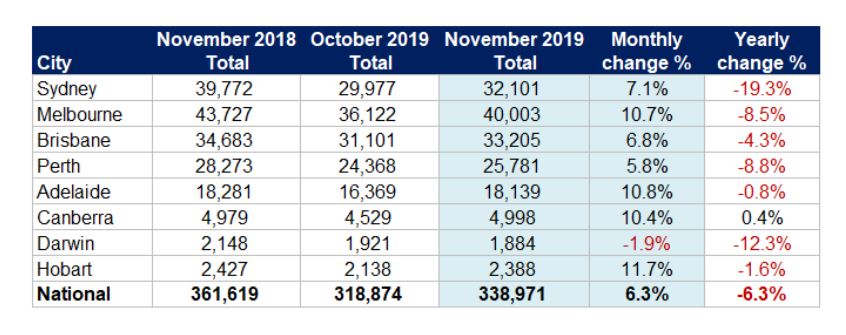
Figures released by SQM Research reveal national residential property listings increased in November by 6.3 per cent, from 318,874 in October 2019 to 338,971, however, compared to 12 months ago, listings were down by 6.3 per cent.
SQM Research's Louis Christopher said all capital cities experienced an increase in property sales listings over the month with the exception of Darwin.
"Darwin continues to experience decreases in listings, with November’s decrease at 1.9 per cent and a yearly decrease of 12.3 per cent," said Mr Christopher.
At a glance:
- National residential property listings increased by 6.3 per cent for November
- All capital cities received an increase of property listings except Darwin
- Hobart recorded the highest monthly increase at 11.7 per cent
"Hobart recorded the highest monthly increase in property listings of 11.7 per cent, followed by Adelaide with a 10.8 per cent increase, Melbourne 10.7 per cent and Canberra a 10.4 per cent increase.
"Sydney recorded a 7.1 per cent increase over the month and is a large improvement year-on-year where the city’s listings declined by a significant 19.3 per cent.
"New listings drove the monthly rise with stock under 30 days old increasing by 5.4 per cent for the month, while stock for over 180 days declined by 3.6 per cent."
The research found year-on-year listings declined for all cities except Canberra which recorded a 0.4 per cent increase.
67 Jacka Crescent, Campbell, ACT is for sale by Steve Lowe of OneAgency. Photo: Luxury List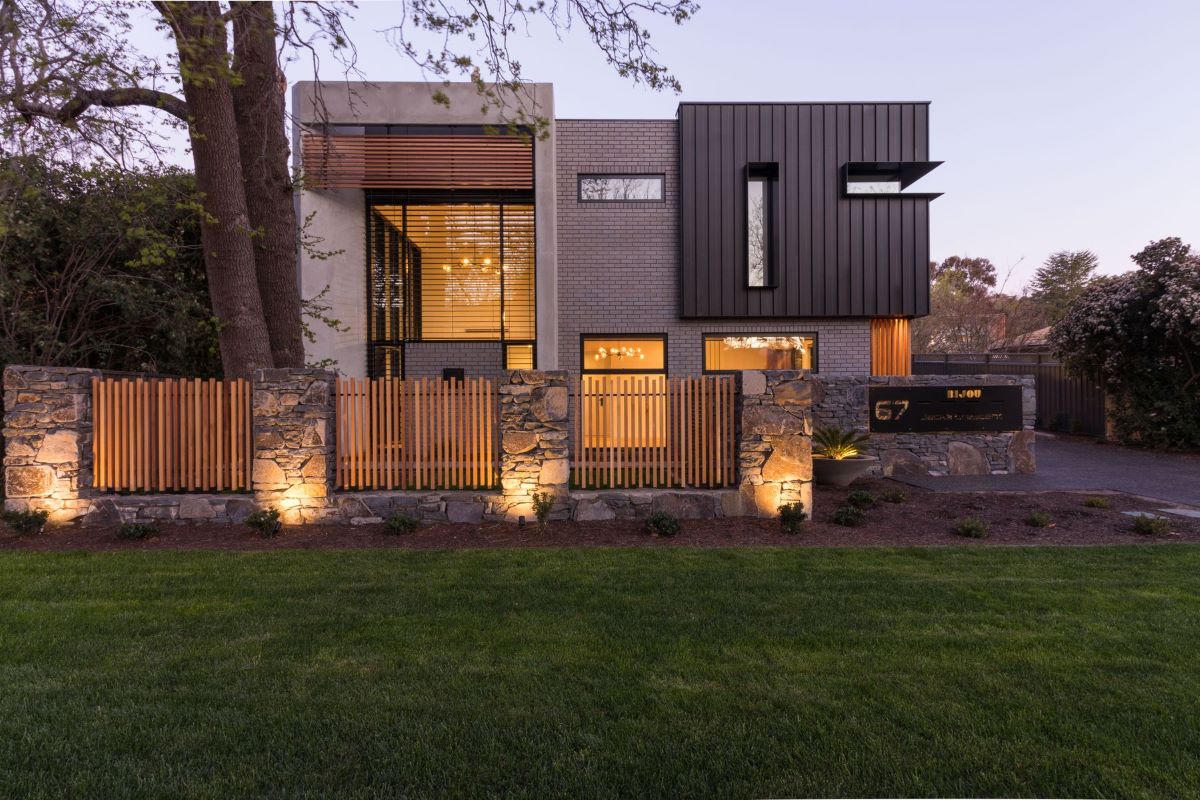
Perth decreased by 8.8 per cent and Melbourne by 8.5 per cent.
Hobart and Adelaide declined by smaller margins over the year, 1.6 per cent and 0.8 per cent respectively.
Mr Christopher said November’s increase in listings indicates the return to a normal spring selling season.
"The rises were primarily driven by new listings, while old stock kept falling," said Mr Christopher.
"This suggests to me that sales volumes are on the rise and that sellers are starting to respond to the rising market."
Capital city asking prices increased marginally by 1.6 per cent for houses and 0.6 per cent for units over the month to 3 December 2019.
Unit asking prices are now $573,100 and houses $954,800.
Source: SQM Research
Compared to a year ago, the capital city asking prices posted increases of 2.4 per cent for houses and increases of 0.7 per cent for units.
Over the month, Sydney, Melbourne, Adelaide and Canberra all recorded increases in both houses and units, with Melbourne showing the strongest growth of 2.2 per cent in the housing market followed by Sydney with a 1.9 per cent increase in house prices.
Brisbane and Hobart both posted increases in house prices - 0.4 per cent for Brisbane and 0.7 per cent for Hobart - however both cities had marginal declines in the unit market of 0.1 per cent for Brisbane and 1.3 per cent for Hobart.
Perth’s housing market remained steady but unit prices have increased 0.9 per cent.
Darwin however, continues its decline in both houses (1.0 per cent) and units (1.3 per cent).
Similar to this:
Property listings on the increase from downturn
Property listings lowest since 2010, CoreLogic
New research shows property listings are soaring in regional towns, but are they really?
Contact Details:
Mathew Chugg
Knight Frank Tasmania


