Spring selling season proves a win for buyers - CoreLogic
Contact
Spring selling season proves a win for buyers - CoreLogic
This year's spring selling season proved less successful for sellers than last year's with overall sales volumes 4% lower than the historic average.
This year's spring selling season proved less successful for sellers than last year's with overall sales volumes 4% lower than the historic average, according to CoreLogic's Housing Chart Pack for December which assessed the performance of the season compared to previous years.

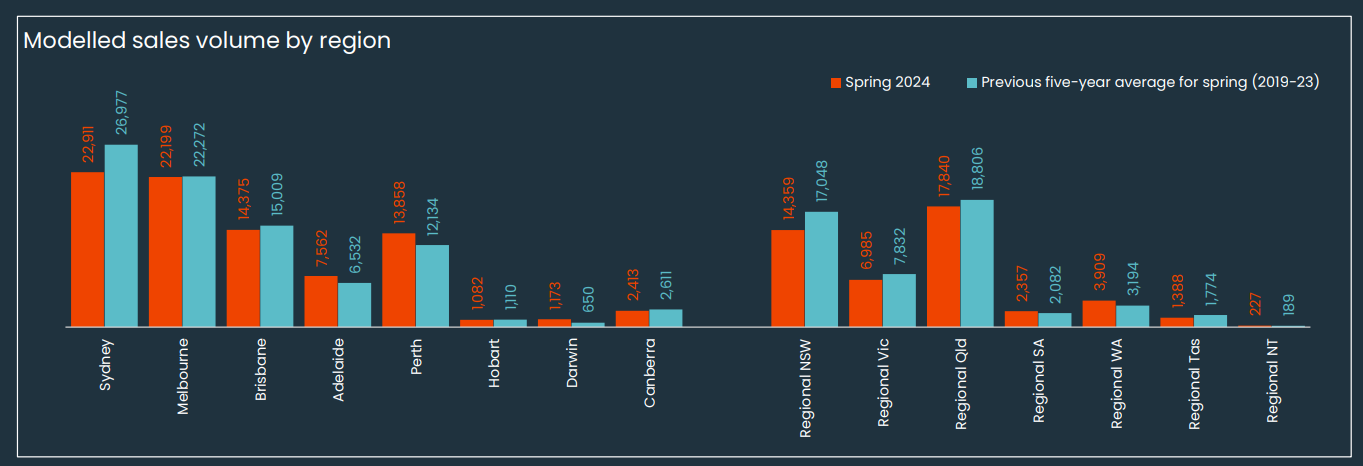
The data shows the figures vary by region with Sydney sales volumes -15.1% lower than the historic average, while in Adelaide they were 15.8% higher.
Nationally, total listings volumes rose 10.6% through spring, and even some of the tighter markets saw an uplift in stock. Notably in Perth, total listing levels topped those seen at the same time last year in the four weeks to December 1st (up by 1.2%) for the first time in 2024. This followed a 34% increase in total listings over the spring selling season across the city.
Across the combined capital cities, the clearance rate moved lower through spring, another sign that markets have weakened. In the four weeks to November 24, the final weighted clearance rate averaged 57.3% across the combined capitals, down from 62.7% in the first four weeks of spring.
Homes took longer to sell through spring
CoreLogic Economist Kaytlin Ezzy said: "Between higher stock levels and lower-than usual sales volumes, the data for the end of November shows that buyers were the winners this spring (just), and sellers generally saw softer market conditions over the past few months."
Nationally, homes also took longer to sell through spring with median days on market in the three months to November ticking up to 32 days, up from 28 days through the three months to August, and 27 days in the spring of 2023.
"The increase in selling times has coincided with higher stock levels, and softer sales volumes year-on-year," she added. "The median time on market increased by four days year-on-year across both the combined capital cities and regional market."
Rental growth continued to slow nationally
Rental growth continued to slow nationally, with rents up 5.3% over the 12 months to November – the slowest annual change since April 2021.
Over the three months to October, capital city rents rose only marginally (0.2%), while regional rental values saw a stronger 0.9% lift.
Ms Ezzy said this could be attributed to slowing demand for rentals in the face of strained rental affordability, potentially prompting the formation of more share houses, or making young Australians reconsider a move out of the family home.
"This is reinforced by RBA reporting on average household size, which has been rising across the capital cities."
"The gradual slowdown in net overseas migration could also be contributing to the stabilising in rent values, and as the backlog of Homebuilder work moves into completion, this could also take some demand out of the rental market."
"Rental growth may rebound a little through the seasonally strong first quarter of 2025, but beyond any seasonality, it looks increasingly like the rental boom is over.”
In November, national gross rent yields remained at 3.7%, marking two years of rent yields holding at this level, however with strong variation across cities.
Over the past year, rent yields have fallen in high capital growth markets like Brisbane, Adelaide and Perth, trended higher in Canberra, Darwin, Hobart and Melbourne, and were steady in Sydney.

Highlights from the December 2024 Housing Chart Pack include:
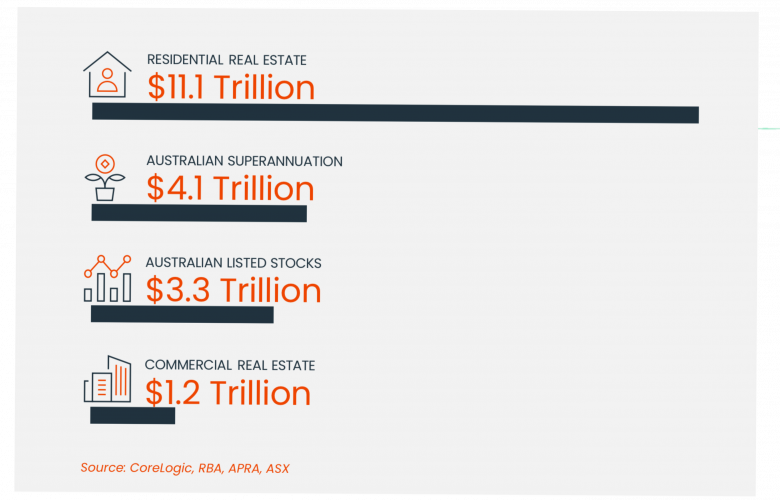
- CoreLogic estimates the combined value of residential real estate rose to $11.1 trillion at the end of November.
- National home values rose 0.5% over the November quarter, though the pace of growth has slowed considerably from a recent high of 2.2% in the three months to April.
- Home value growth continues to be skewed to the more affordable end of the market with the most affordable 25% of Adelaide (4.7%), Perth (4.5%) and Brisbane (31%) rising the fastest. Meanwhile, home values in the upper quartile markets of Darwin (-2.7%), Melbourne (-1.4%) and Sydney (-1.6%) has seen the largest declines over the quarter.
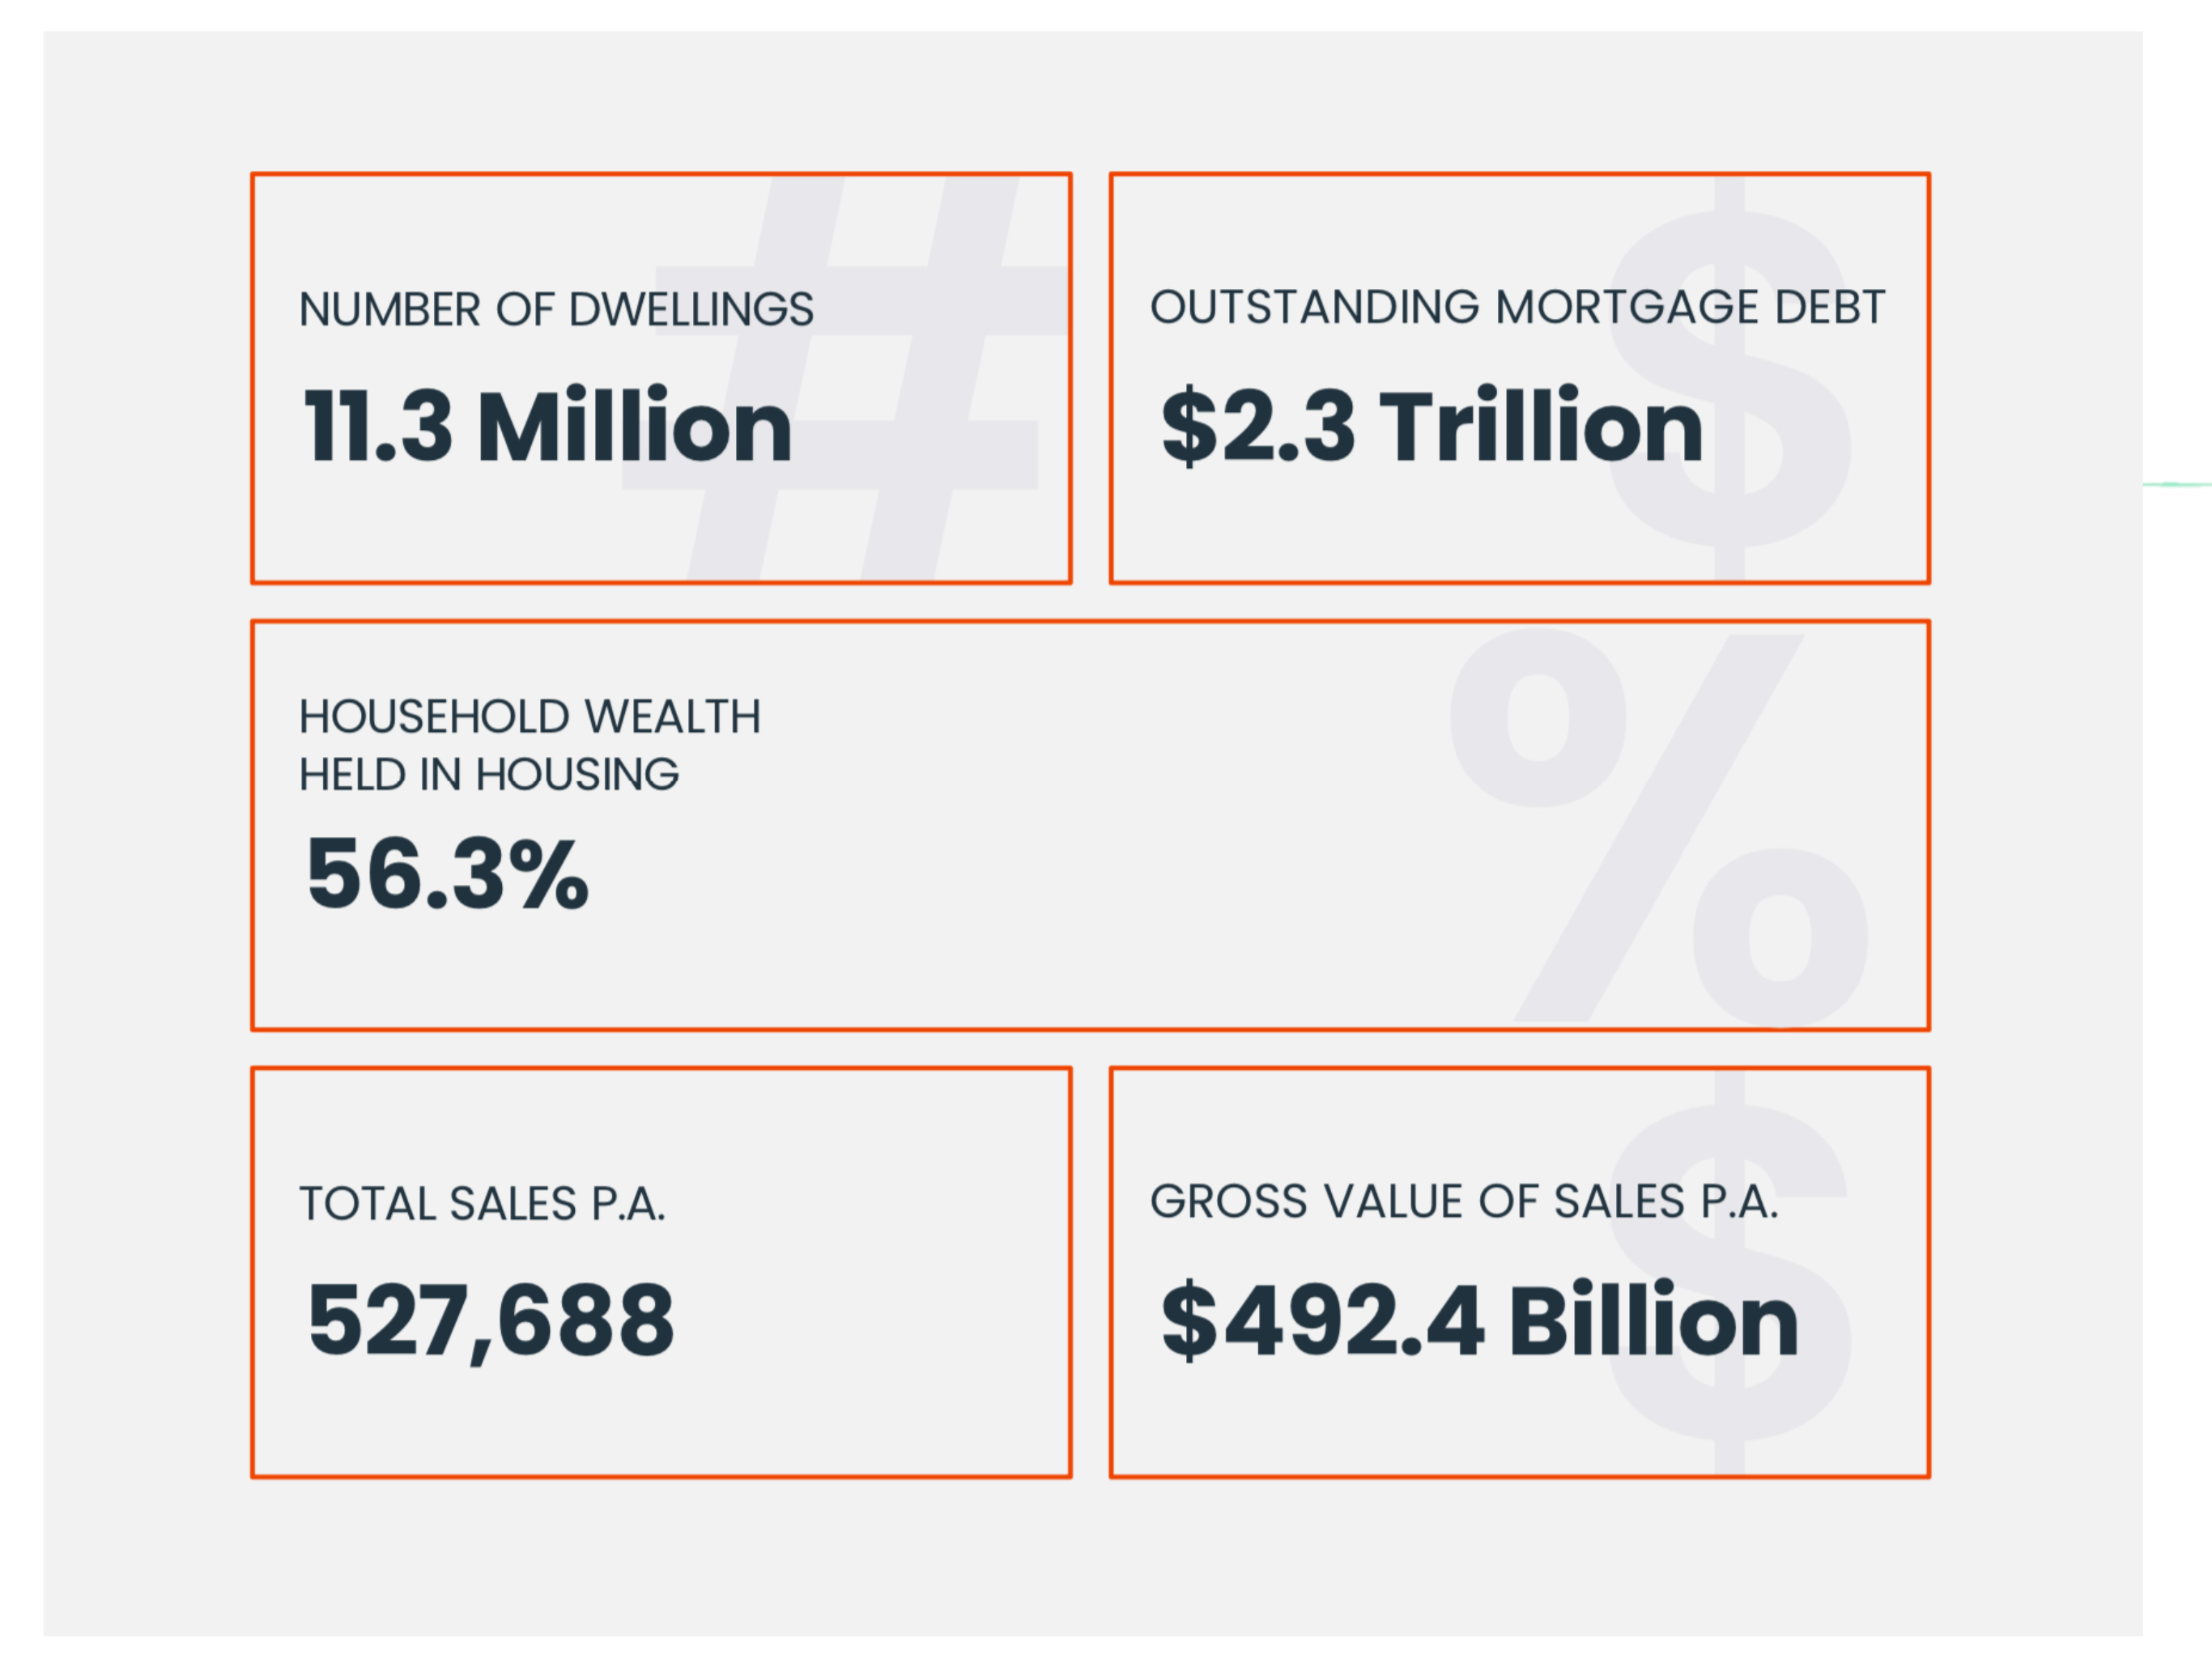
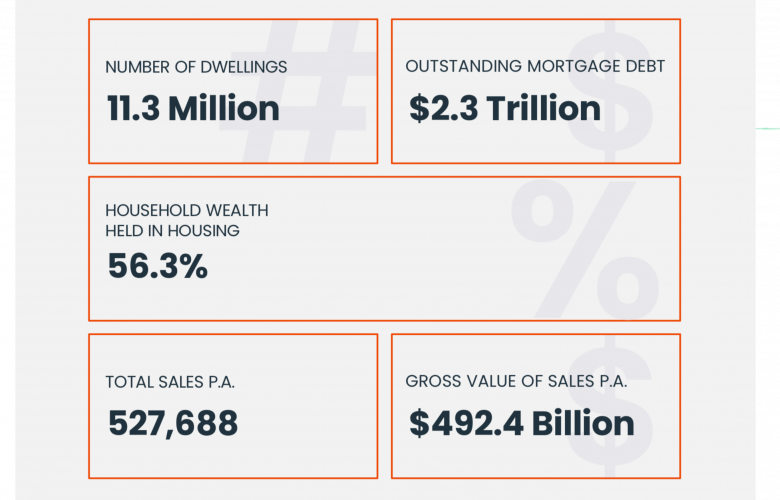
- CoreLogic estimates there were 42,771 sales in November, taking the annual count to 527,688 in the 12 months to November. At this stage, spring sales volumes for 2024 are sitting -4.0% lower than the previous five-year average, and the rolling six-month trend in home sales has also moved lower.
- Days on market has increased to 32 days in the three months to November, up from 28 days through the three months to August and 27 days in the spring of 2023. The increase in selling times has coincided with higher stock levels, and softer sales volumes year-on-year.
- Despite slower growth in housing values, higher days on market and higher stock levels, the median vendor discount through spring nationally was steady compared to spring last year, at - 3.6%.
- Following a strong flow of properties hitting the market earlier In spring, listings totaled 45,878 In the four weeks ending 1 December 2024. This is down -0.2% year-on-year and -4.0% lower than the historic five-year average for the same time of year.
- Total listings have continued to trend higher over spring, with the recent flow of new stock taking total listings to 156,151 in the four weeks to 1 December 2024.
- Rental growth continued to slow nationally at 5.3% annually, the slowest annual change since April 2021.
- The December ‘Chart of the Month’ looks at spring sale numbers across the capital cities and major regions compared to historic averages. CoreLogic estimates there were around 133,000 sales through spring 2024, -4.0% lower than the historic five-year average. Across the cities and regions, there was a lot of variation, with Sydney sales -15.1% lower than historic averages, and Adelaide sales 15.8% higher.
More CoreLogic readings
Lowest preliminary clearance rate since December 2022 - CoreLogic | The Real Estate Conversation
Auction activity up week-on-week across combined capitals - CoreLogic | The Real Estate Conversation


