Almost 30% of suburbs have seen values fall over the quarter - CoreLogic
Contact
Almost 30% of suburbs have seen values fall over the quarter - CoreLogic
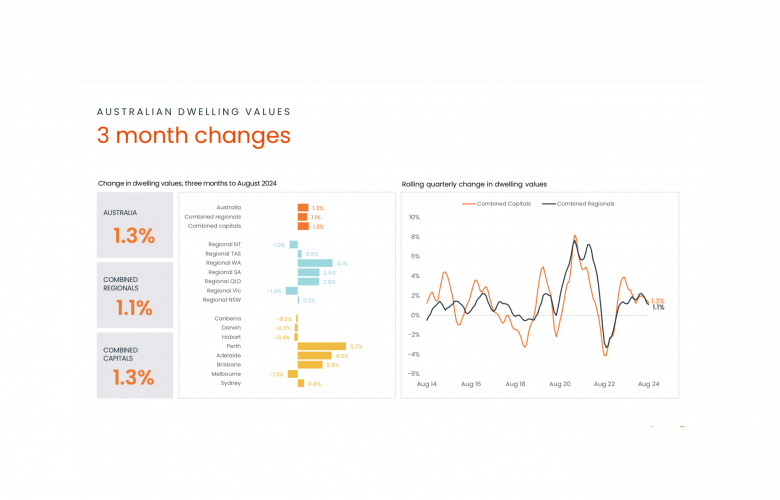
In CoreLogic's Housing Chart Pack, the September ‘Chart of the Month' takes a granular look at value falls over the three months to August, with almost 30% of the 3,655 suburbs analysed across Australia in decline, says CoreLogic Economist Kaytlin Ezzy.
In CoreLogic's Housing Chart Pack, the September ‘Chart of the Month' takes a granular look at value falls over the three months to August, with almost 30% of the 3,655 suburbs analysed across Australia in decline.
Melbourne (79.1%) and regional Victorian suburbs (73.8%) made up the majority of falls over the quarter. Values also decreased across more than half of the suburbs in Hobart (54.3%), Darwin (51.2%), and Canberra (51.6%), while all suburbs in Perth saw values rise over the quarter.
CoreLogic Economist Kaytlin Ezzy said quarterly value declines are becoming more common as high interest rates, cost of living and affordability challenges continue to bite.
"While values are still rising at the national level, albeit at a slowing pace, beneath the headline figure, we're starting to see some weakness, particularly in Victoria."

"In Melbourne, declines were most concentrated in more affluent regions, with 100% of suburbs in the Mornington Peninsula recording decreasing values, while just one suburb in the Inner-South (Carrum) and three suburbs in the Inner-East (Box Hill, Deepdene, Canterbury) saw values rise over the quarter. A similar pattern played out in regional Victoria, with Ballarat (100%), Geelong (97.8%) and Bendigo (89.3%) recording the highest concentration of falls."
Ms Ezzy noted that this fresh view of the data highlighted a creeping weakness in demand, and the variation in market conditions.
“Nationally the portion of suburbs in quarterly decline was 29.2% in August, which has risen from 17.2% a year ago. Behind Melbourne, Sydney has seen the biggest increase in the share of suburbs in decline over the past year, from 3.8% to 25.9%.”
"At the other end of the scale is WA. Of the 146 suburbs analysed across regional WA, 127 recorded a quarterly rise in dwelling values, while all 302 Perth suburbs saw values rise.

“This data shows a remarkable turnaround in the Perth market. In the three months to September 2022, 60.1% of Perth suburbs were in decline. In the three months to August 2024, there was not a single suburb analysed where prices had fallen.
"Across Perth, value increases ranged from a 1.8% rise in Marmion in the city's North-West, to 10.6% in Henley Brook in Perth's North-East."
Looking forward, Ms Ezzy says despite the continued strength in some markets, its likely value declines will become more common as the spring selling season commences.
"The flow of new listings has already been above average through winter, which has translated into slowing growth. We're already starting to see the early signs of a slowdown in markets like Adelaide and Brisbane, with 3.1% and 3.8% of suburbs, respectively, recording falls."
"It's likely this easing will continue into the seasonally busier spring selling period, with additional listing putting further downward pressure on values.”

More CoreLogic readings
Winter chill weighs on the housing growth trend - Corelogic | The Real Estate Conversation
Preliminary clearance rate bounces back above 70% - CoreLogic | The Real Estate Conversation
The end of the rental boom is in sight - CoreLogic | The Real Estate Conversation


