Super Saturday as Christmas draws near
Contact
Nov 29, 2019
Super Saturday as Christmas draws near
Despite CoreLogic figures showing fewer house listings, Devine Real Estate is bucking the trend and prepares for Super Saturday tomorrow.
-
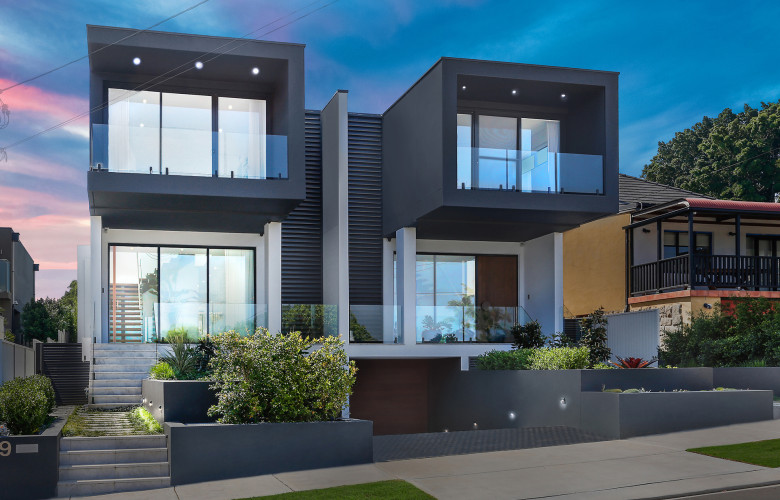 Luxury List9 Blackwall Point Road, Chiswick is going to auction this Saturday through Devine Real Estate
The number of new listings added to the national housing market through November was up 56 per cent from the depths of winter, however compared with previous spring periods, newly advertised stock hasn’t been this low since CoreLogic began tracking listings in 2007.
With fresh listings at a lower than normal level and buyer demand rising, the total number of advertised properties available for sale is also tracking at historic lows, down 12.4 per cent nationally compared with last year and the lowest reading for this time of the year since 2009.
With buyers taking advantage of the lowest mortgage rates since at least the 1950s along with an improvement in credit availability/borrowing capacity, market activity is rising.
At a glance:
- New listings up 56 per cent from winter across the nation
- Lowest mortgage rates since the 1950s
- Total number of sales down 12.4 per cent compared to last year
With such a small pool of stock available for sale, competition amongst buyers is increasing, adding a sense of urgency to the market which is another factor supporting price growth at the moment.
This is what Craig Stokes of Devine Real Estate in Sydney's inner west is counting on.
The agency is holding a Super Saturday where they will have seven properties go under the hammer.
"With our agency we hold a Super Saturday on the first weekend in December," Mr Stokes said.
"People want to avoid the last minute mad rush before Christmas.
"For these properties, settlement period will be in mid-January, so they want to organise their lawyers and finance before everything closes up."
9 Blackwall Point Road, Chiswick is up for auction tomorrow through agents Fayez Yammine and Joe Kanaan of Devine Real Estate. Photo: Luxury List
CoreLogic found the largest drop in new listings numbers can be seen in Darwin, down almost 40 per cent compared with last year, while Hobart (-23.3 per cent) and Perth (-23.0 per cent) have also recorded a substantial drop relative to last year.
Total listings numbers were the lowest relative to a year ago in Sydney (-23.1 per cent), Perth (-16.6 per cent) and Melbourne (-15.7 per cent).
The low number of spring listings likely reflects a combination of factors.
In markets where housing conditions have been weak, like Darwin and Perth, a lack of vendor confidence is understandable.
Selling conditions have been tough in these markets since 2014 and prospective home sellers are likely wary of the challenging selling conditions, where homes are taking a long time to sell, discounting rates are high and properties are often selling for a lower amount than what they were purchased for.
In stronger markets like Sydney and Melbourne, the low number of listings being added to the market is more surprising.
One reason could be related to overall consumer confidence remaining low.
Selling a home, as well as buying a home, is a high commitment decision that is harder to make when confidence in the overall economy and future household finances is low.
Another factor relates to the speed of the market recovery.
It was only five months ago that housing values were still broadly falling.
Preparing a property for sale involves a number of processes that take some time, including making the decision to sell, finding an agent, preparing the home for sale and commencing a marketing campaign.
Considering this, if selling conditions remain strong through early summer, we could see the market being tested with a larger number of listings through early December or the first quarter of next year.

Source: CoreLogic
Sydney
There were 6,879 new listings added to the market over the first four weeks of November, 19 per cent below the decade average and 3.2 per cent lower than a year ago.
This was the lowest count of new listings for this time of the year since CoreLogic listing records commence in 2007.
Total listings were running at 24,360 across Sydney over the same period, 23% per cent lower than a year ago and almost 13 per cent lower than the decade average.
The short supply levels are adding some urgency to local market conditions as active buyers compete across a relatively small pool of available stock for sale.
Melbourne
There were 8,603 newly advertised properties added to the Melbourne housing market over the first four weeks of November; 7.4 per cent lower than a year ago and 7.7 per cent below the decade average.
New listing numbers haven’t been this low since 2011 when the market was still moving through a downturn.
Total listing numbers across Melbourne (32,862) were almost 16 per cent lower than a year ago and 0.6 per cent below the decade average.
When the market was moving through peak growth conditions in 2015, total advertised stock levels were only slightly lower than their current level.
Brisbane
4,039 fresh listings were added to the Brisbane market over the first four weeks of November, tracking almost 14 per cent lower than a year ago and 11 per cent below the decade average.
This was the lowest number of new listings added to the market for this time of the year since 2012.
Total listing numbers remain relatively low across Brisbane.
There were 20,704 properties advertised for sale across the market over the past four weeks, which was 8.1 per cent lower than a year ago and 3.7 per cent below the decade average.
Adelaide
The past four weeks saw 2,362 fresh listings added to the Adelaide housing market, down 10.3 per cent compared with the same period a year ago and 6.2 per cent below the decade average.
This was the lowest number of new listings for this time of the year across Adelaide since CoreLogic listing records commenced in 2007.
The past four weeks saw 8,878 total listings available for sale across Adelaide which was 4.0 per cent lower than a year ago and 3.1 per cent below the decade average.
Perth
Only 3,392 newly listed properties were added to the Perth market over the past four weeks, down 23 per cent from last year and 23.1 per cent below the decade average.
Fresh stock being added to market is well below what might be described as normal levels, with the November 2019 reading the lowest since CoreLogic listing records commenced in 2007.
Total listing numbers, at 18,312 over the first four weeks of November, were almost 17 per cent lower than a year ago and tracking 4.2 per cent below the decade average.
Total listings haven’t been this low, for this time of the year, since 2013, just before the market peaked across Perth.
Hobart
Only 396 new listings were added to the Hobart housing market over the past four weeks, 23 per cent lower than a year ago and 24 per cent below the decade average.
The number of fresh listings being added to the market hasn't been this low, for this time of the year, since CoreLogic started tracking listings in Tasmania in 2009.
Similarly, total advertised stock levels are also tracking at seasonal lows.
The past four weeks saw 1,087 residential properties for sale across Hobart, which was 15.4 per cent lower than a year ago, tracking at roughly 50 per cent of the decade average.
Such low stock levels are likely to add further upwards price pressures to the Hobart market as buyers compete for such a small pool of properties available for sale.
Darwin
Only 121 new property listings were added to the Darwin market over the past four weeks; 39 per cent lower than a year ago and 43 per cent below the decade average.
Since CoreLogic commenced tracking listing numbers across the Northern Territory in 2007, fresh stock levels have never been this low for this time of the year.
Total listing numbers were tracking at 1,324 over the past four weeks, which was almost 10 per cent lower than a year ago, but 2.6 per cent above the decade average.
Total advertised stock levels are generally elevated across Darwin, despite the low number of new listings, reflecting weak buyer demand and ongoing challenging selling conditions.
Canberra
761 fresh listings were added to the Canberra housing market over the past four weeks, which was almost 17 per cent lower than the number added at the same time last year, but 2.2 per cent higher than the decade average.
This was the lowest number of new listings added to the market, for this time of the year, since 2014.
Total listing numbers were tracking at 2,430 across Canberra over the past four weeks, down almost 9 per cent from last year but 4.6 per cent above the decade average for the city.
Higher than normal stock levels across the city suggest buyers probably aren’t facing a great deal of urgency in this market and can potentially drive a harder bargain at the negotiation table.
Similar to this:
CoreLogic data preview says property prices fell in May
Contact Details:


